DGX Spark dies suddenly
I run a small GPU cluster of NVIDIA GB10 Grace-Blackwell machines. Two of them are, on paper, the same box: same SoC, same 20 cores, same 128 GB of unified memory, both running as GPU workers. Call them box-a and box-b.
One of them kept dying. Not crashing — dying. Mid-workload, the whole machine would vanish off the network in an instant. The other one, running the exact same jobs, never flinched.
This is the story of chasing that down, being wrong about the cause more than once — including a firmware theory I was sure about — and the boring one-liner that finally made the box stop dying.
The workload that triggered it
The job that killed it was video generation — an audio-driven talking-head diffusion model (Wan2.2-S2V) rendered through ComfyUI. Every other GPU workload on the box was fine: LLM inference via Ollama, weather-model inference, image work. Only the video-diffusion render reliably took the machine down, a few minutes in.
That “only this one workload” clue turned out to matter enormously — but not in the way I first assumed.
The red herring: it looked thermal
The box was hot. Under render, its SoC package sat at 93–98 °C, and telemetry showed it right up to the moment of death. Case closed, obviously: it’s overheating and hard-tripping.
So I pulled the box from the render pool, treated it as a cooling problem, and moved on. Except the story didn’t hold together:
- The GPU power draw was modest on average — under 90 W, nowhere near a limit.
- The box reached the same temperatures during other inference that never crashed.
- There was no thermal-shutdown message in the logs. A real software thermal trip logs
critical temperature reachedand starts an orderly poweroff. This wasn’t orderly — it was a light switch.
If the temperature is identical between a workload that survives and one that dies, temperature isn’t the discriminator. I’d anchored on the biggest number on the dashboard and stopped looking.
The tell: what the kernel didn’t say
The thing that broke the thermal theory was the absence of evidence. I went through the kernel journal across every death:
- No
critical temperature/ thermal-shutdown. - No GPU
Xiderror (what you’d see if the GPU driver faulted). - No kernel panic, no MCE, no machine-check.
- No shutdown sequence at all.
The log just stopped — mid-sentence, during mundane userspace chatter — and the next line is the next boot. That signature is not a hot chip protecting itself and it’s not a driver crash. It’s an instantaneous power/electrical halt: the board yanked power below the level where the OS gets a word in.
Which lines up perfectly with “same temperature, only dies on one workload.” It was never about heat.
The evidence: brake counts
My cluster dashboard has a per-node “flight recorder” that, among other things, counts power/EDPp brake events — the fast electrical slowdowns a GPU applies when it rides its power-delivery limit. Side by side, at nearly identical average power (93 vs 94 W) and board temperature (95–98 °C on both), the two boxes told completely different stories:
box-a was braking on power ~10× more often than box-b, then eventually one excursion pushed past the board’s limit and cut the whole thing. The temperature instability I’d noticed earlier — box-a’s clocks and temps sawtoothing while box-b held a clean flat line — was a symptom of all that braking, not a cause.
Why this workload
If it’s electrical, why did only video diffusion trigger it? Because of the shape of its power draw, not the average:
- LLM inference (the workloads that survived) draws power smoothly — steady token-by-token compute.
- Diffusion video is bursty: sharp per-denoise-step load-steps, VAE-decode spikes, and — because it splits/encodes video with
ffmpegon the CPU interleaved with the GPU render — it loads the Grace CPU cores and the Blackwell GPU at the same time, off one shared package power budget.
Those steep transients (high dI/dt) are exactly what trips a marginal power-delivery design, even when the average watts and the temperature look identical to a workload that’s perfectly happy. A 1 Hz power sensor never even sees the peaks.
The hypothesis: the boxes were not identical
Here’s the part I should have checked on day one. I’d assumed “two GB10 boxes” meant “two identical boxes.” They share the NVIDIA GB10 SoC — but they’re different products from different vendors, with different firmware:
box-a (kept dying) | box-b (fine) | |
|---|---|---|
| Product | GIGABYTE AI TOP ATOM (board P4242) | NVIDIA DGX Spark (GX10) |
| System BIOS | 5.36_0ACUM05 (Nov 2025) | GX10DGX…0326 (Mar 2026) |
| GPU vBIOS | 9A.0B.**0F**.00.1D | 9A.0B.**1E**.00.00 |
The GPU vBIOS is where the power and EDPp tables live — the very thresholds that decide when and how hard the card brakes. box-a shipped with an older vBIOS, and the theory wrote itself: older power tuning, marginal for these transient-heavy workloads, same silicon but worse firmware. That looked like the smoking gun. It wasn’t.
What I tried first: the firmware flash (and why it didn’t hold)
The obvious move was to make box-a match its twin: flash its firmware from the board vendor (GIGABYTE), not from NVIDIA, since it’s a GIGABYTE board. On this GB10 platform the update runs through fwupd with UEFI capsule-on-disk, so it’s doable over SSH (the flash applies during a controlled reboot):
sudo fwupdmgr refresh --force
sudo fwupdmgr get-updates      # review what's offered
sudo fwupdmgr update           # stage the capsules
sudo reboot                    # applied during boot
The flash landed — the version strings moved, and the vBIOS jumped several revisions:
| before flash | after flash | |
|---|---|---|
| System BIOS | 5.36_0ACUM05 | 5.36_0ACUM07 |
| GPU vBIOS | 9A.0B.0F.00.1D | 9A.0B.25.00.00 |
| Hard-cut under render | yes | still yes |
For the first few short renders it looked cured, and I nearly wrote the victory post right there. Then I queued a long S2V batch — and the box blinked off the network mid-render, same instantaneous signature as before. New firmware, newer vBIOS than the healthy box even, and the same death. Firmware moved the numbers; it didn’t move the outcome. I’d been sure, and I was wrong again.
One caveat worth stating for anyone flashing these: this class of box has no BMC / out-of-band management, so a failed flash means physical USB recovery, not a remote console. Flash with physical access available, and prefer the vendor’s capsule/dashboard path over raw flashers.
The fix that actually held: cap the GPU clock
If the deaths are transient power excursions, the pragmatic move isn’t to chase the perfect power table — it’s to lower the ceiling. Stop the clock (and therefore the peak current) from ever reaching the excursion that trips the board. On this platform that’s a one-liner:
# lock the GPU graphics clock to a 2200 MHz ceiling
sudo nvidia-smi -lgc 0,2200

# clock locks don't survive a reboot — a tiny systemd unit
# re-applies the same line on boot so the cap is permanent
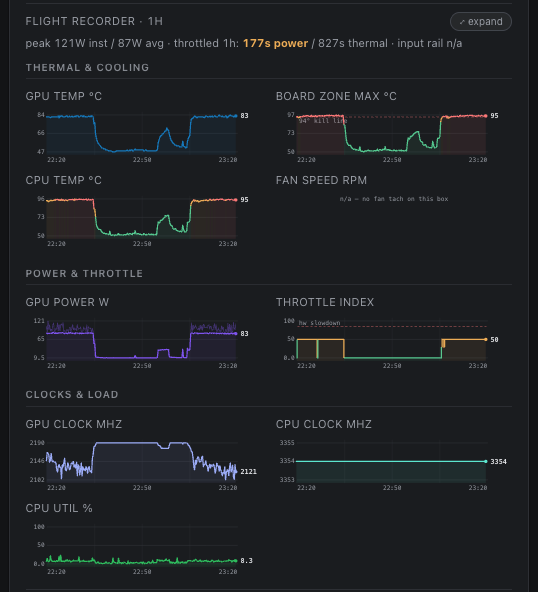
That was it. Capped at 2200 MHz, box-a stopped spiking: the GPU clock plateaus instead of sawtoothing, the power peaks flatten, and — crucially — the box stops hard-cutting. It now rides the power limit and soft-throttles for the whole render instead of yanking its own plug.
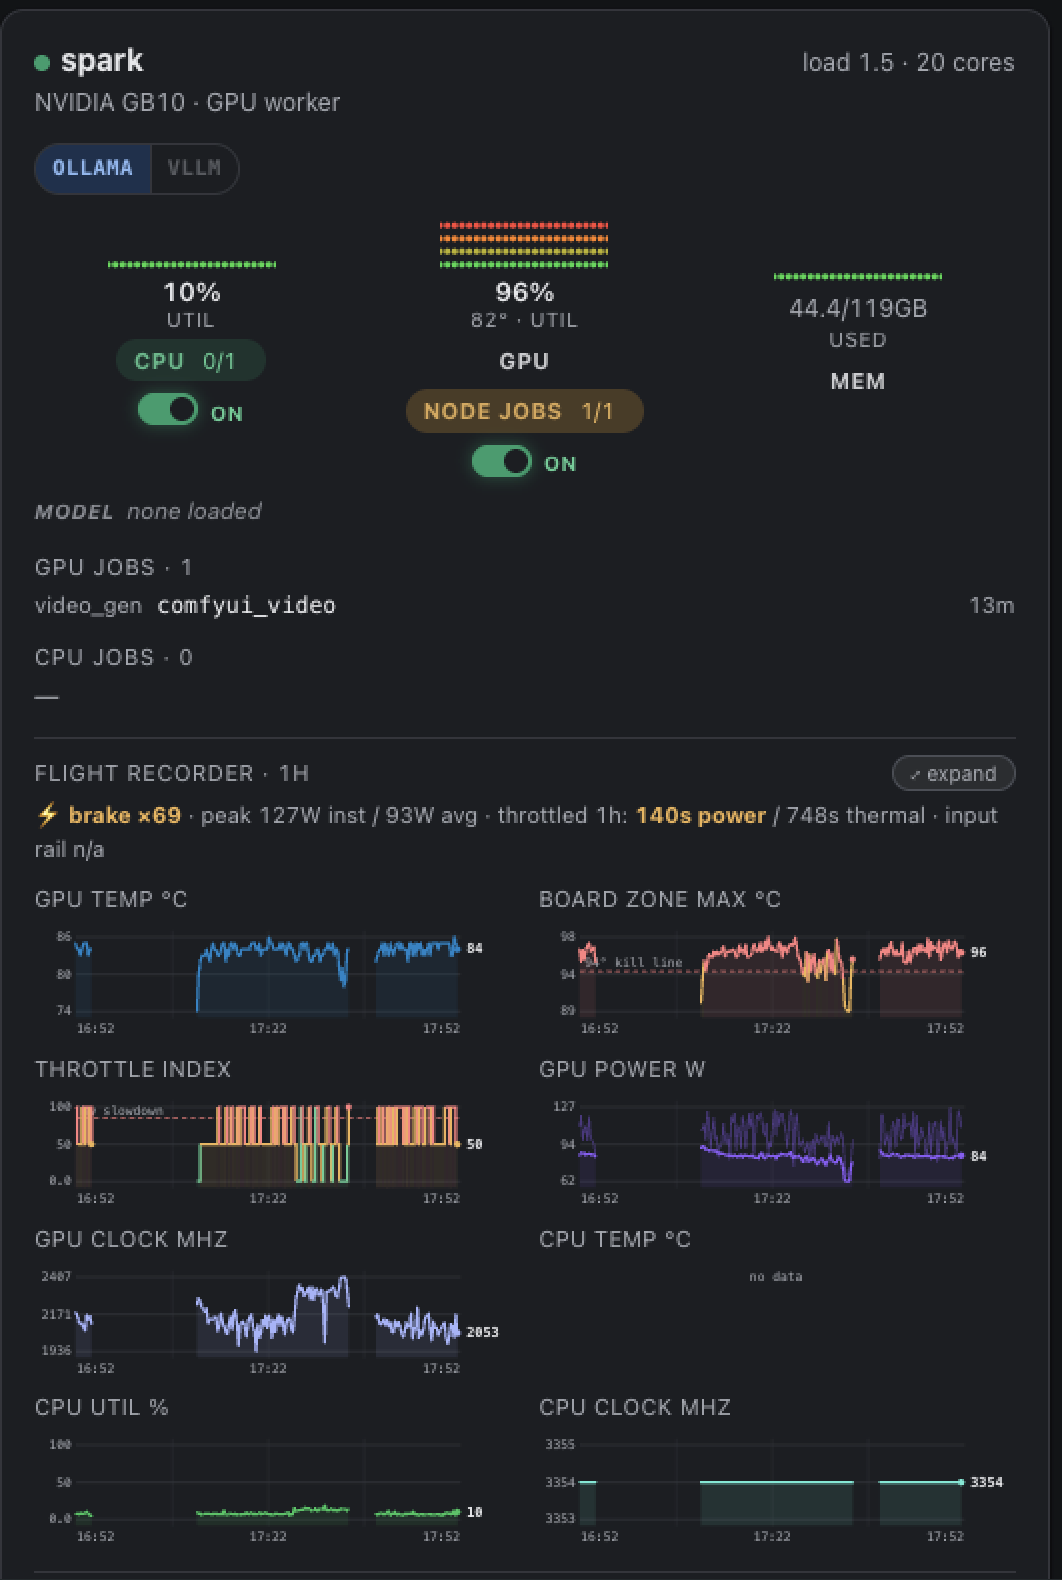
Same box, same video-generation job. First, the flight recorder before the cap — brake ×69, and look at the GPU clock: it sawtooths between 1936 and 2407 MHz, power lurches toward 127 W, and the throttle index is a wall of slowdown events:
And after locking the clock to 2200 MHz:
The one-line summary of the whole saga:
| uncapped | GPU locked ≤ 2200 MHz | |
|---|---|---|
| GPU clock under render | sawtooth, spikes to the ceiling | plateau, bounded |
| Power brakes | ×69/hour, one ends in a hard-cut | rides soft throttle, no cut |
| 1-hour S2V render | dies in minutes | completes, every time |
A few percent of peak clock, traded for a node that stops vanishing. box-a went straight back into the render pool and has stayed there.
So what was it, really?
Capping the clock is a workaround, not a diagnosis — and I want to be honest that I don’t have a clean root cause with a bow on it. What I can say is that it’s specific to this one unit.
The same Wan2.2-S2V job runs clean on box-b (the DGX Spark) and on a third, different-vendor box (an ASUS GB10) — untouched, no cap, no deaths, ever. Identical workload, identical software, identical silicon. So it isn’t the platform and it isn’t the model. It’s this one machine’s power/thermal margin being a hair too thin for the steep transients of video diffusion — and the usual causes of a unit-specific margin like that are physical and probabilistic:
- how evenly the thermal paste landed on the APU at assembly (a poor spread → a local hot spot → a marginal power-delivery corner),
- dust in the fin stack,
- the box’s physical position and airflow on the shelf.
Any of those can push one particular unit over a line the others never reach — and none of them leave a tidy log line. Capping the clock works precisely because it pulls the peak dI/dt and peak power back inside whatever margin this box actually happens to have. It’s the silicon-and-assembly lottery, worked around rather than won.
How I run and watch the cluster
The flight recorder above — the per-node brake counts, throttle traces, clock/power/temperature panels, and the job scheduler that placed (and failed-over) these renders across boxes — is all part of broker_parrot, my Postgres-as-queue workflow engine for coordinating GPU work across a heterogeneous cluster. One-model-per-box leasing, per-box placement rules, health/heartbeat tracking, and the telemetry that made this bug findable in the first place:
→ github.com/robertziel/broker_parrot
Lessons
- The biggest number on the dashboard is a suspect, not a verdict. 98 °C looked like the cause; it was a bystander. The discriminator was a workload that survived at the same temperature.
- Absence of evidence is evidence. No thermal log, no Xid, no panic, no shutdown sequence — that pattern is the diagnosis (a power halt), not a dead end.
- Average power hides transients. Diffusion’s bursty CPU+GPU load is a different electrical animal than steady LLM inference, even at equal watts.
- “Identical” hardware isn’t — and the gap may not be fixable in firmware. Same SoC ≠ same board ≠ same unit. I matched the firmware (newer, even) and the box still died. Sometimes the difference is baked into one physical unit, not its flash.
- When you can’t fix the cause, lower the ceiling. A capped GPU clock is a boring, reversible one-liner — and it beat a heroic root-cause hunt. The right engineering answer to a marginal unit is a margin, not a diagnosis.